This Determines If You Win or Lose In Stocks, Real Estate, Gold & Silver
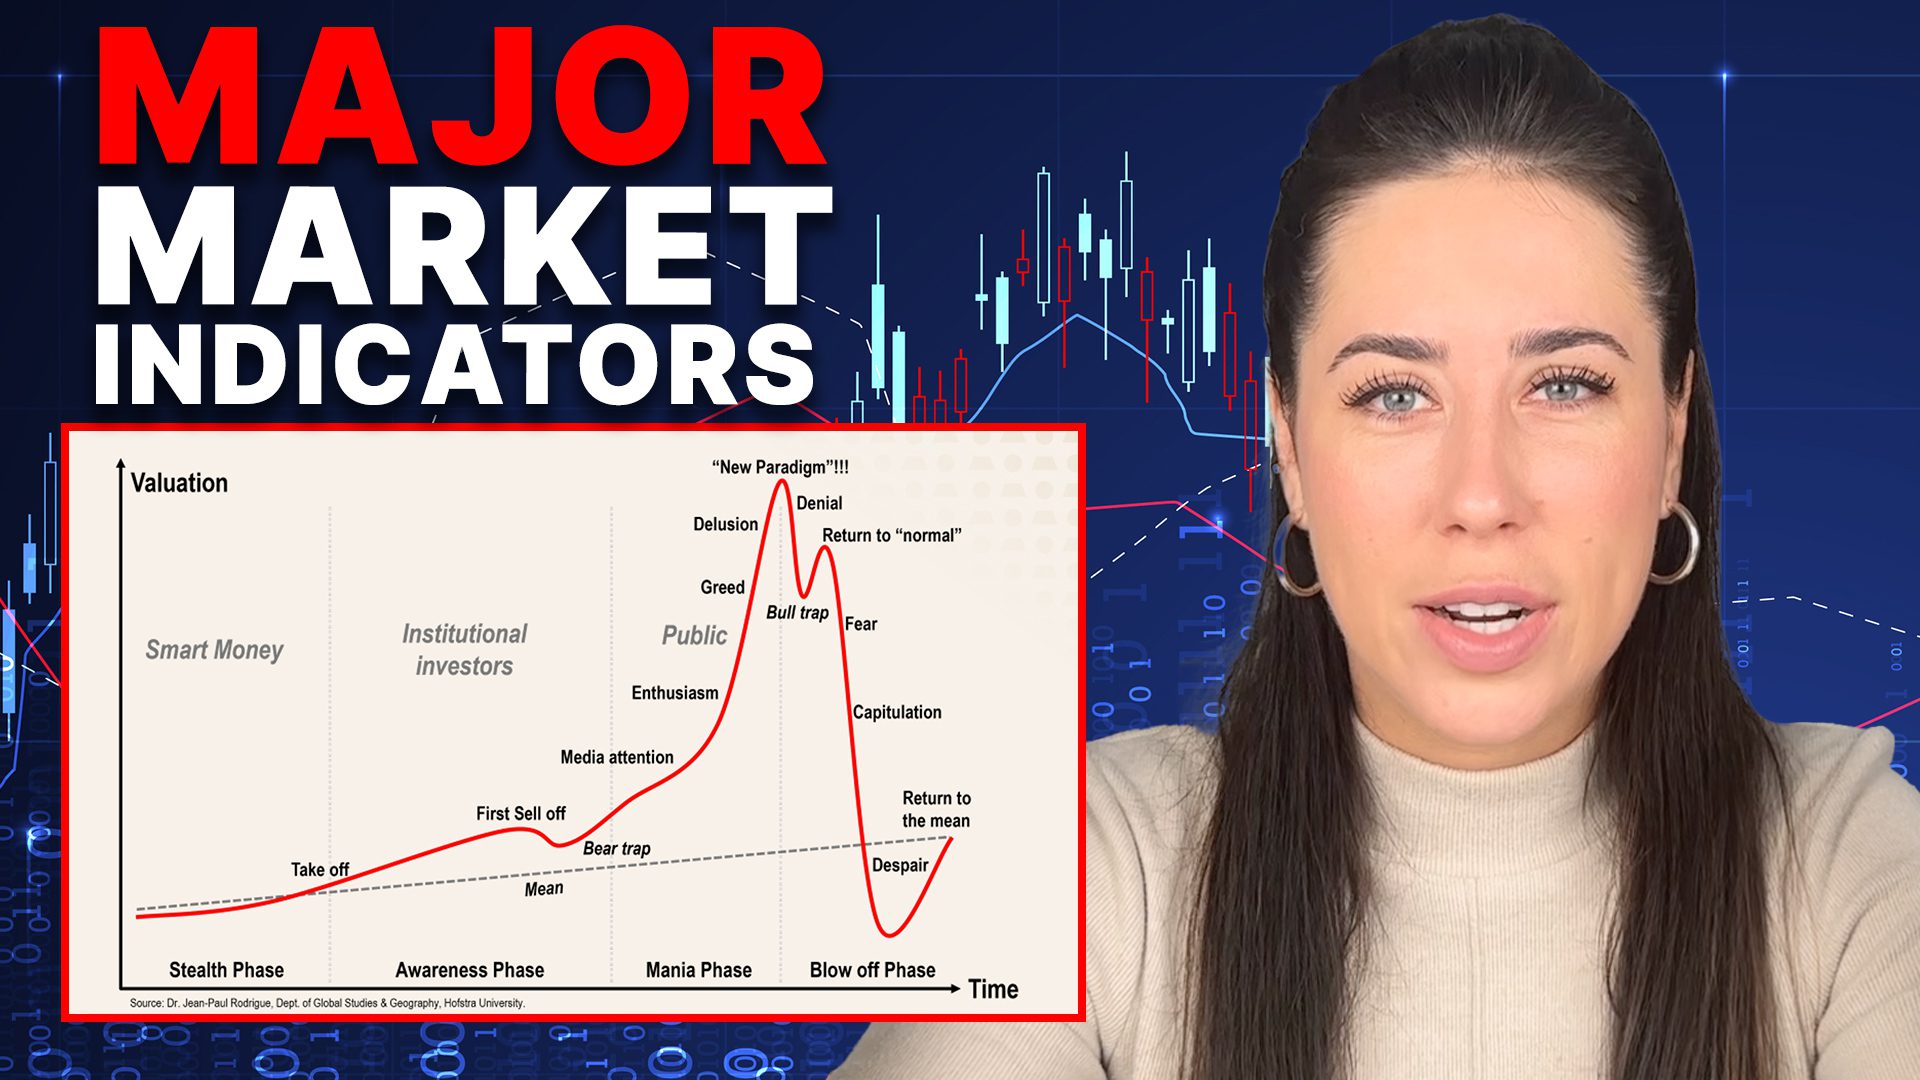
Learn the proven cycles and patterns in the stock market, housing, commercial real estate, and precious metals. This condensed video exposes how smart money accumulates early while media hype creates greed that leads to inevitable crashes. By understanding these trends, you can make informed decisions and profit before the next correction wipes out paper profits.
CHAPTERS:
0:00 Analyzing Trend Cycles
1:33 Trend Cycles & Investment Opportunities
4:24 Stock Market
5:25 Commercial Real Estate
6:20 Housing Market
7:17 Spot Gold & Spot Silver
8:54 Smart Money
SLIDES FROM VIDEO:
TRANSCRIPT FROM VIDEO:
With so much noise around the markets, it feels impossible to understand when to buy and when to sell. But make no mistake, this confusion is intentional. They don’t want you to understand how to recognize patterns that will help you break out of the system that they’ve created by keeping you confused and in the dark about proven trend cycles. You end up being the one holding the bag when it all comes crashing down. But thankfully, together we will show that everything is a pattern, and if you can understand and read this pattern, then you will be able to make simple informed decisions to protect yourself.
Hi everyone. I’m Taylor Kenney with ITM Trading, and it has never been more important or more timely to understand the patterns of what’s going on so that you can protect yourself. What they don’t want you to know is where we are in the cycle. So today we’re going to look at the stock market, housing, commercial real estate and spot markets, applying a pattern so that you can take that knowledge and make the most informed decisions for yourself. Lynette did an incredible video on this a couple of weeks ago, and you were asking for a condensed version that you could quickly reference and share with friends and family. So she and I got together and decided, since it is such a crucial topic, we cannot talk about it enough because you are going to see that once these trends are exposed, you can apply them to everything. Especially now that everything is a tradable asset, it has never been more important to take the power back into your own hands.
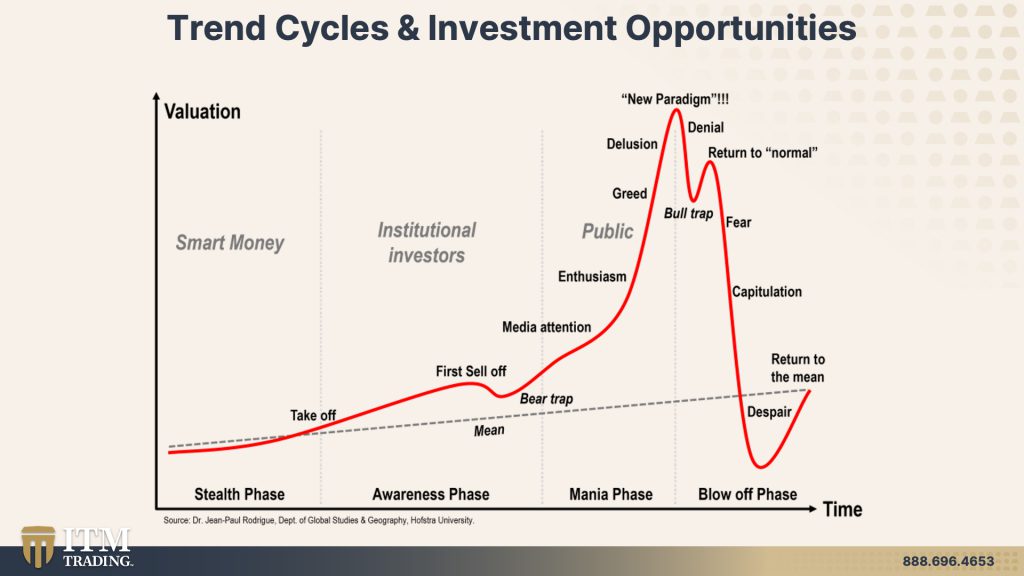
Let’s take this simple trend cycle together and break down what it means starting at the beginning with the accumulation phase, this is the period we’re all familiar with. When everyone, the media, the financial talking heads, your friends and your family even are gonna say, don’t buy. Don’t buy. It’s not worth anything. It will never be worth anything. What a waste of money. This phase can be hard to spot if you don’t know what to look for, but this is where smart money is quietly accumulating. This is of course where we want to be. This is also when we’ll start to see maybe Wall Street take notice, even though it’s quietly accumulating enough money accumulates and people will start to notice, which will result in a takeoff and will bring us into our second phase, which is the awareness phase when people start to be aware of this asset and it’s rising value, and this is when we’ll really start to see some sentiment ups and downs for the first time. Should I be involved? Should I not? It’s volatile, it’s going up and down. It’s figuring itself out. Wall Street’s only in it for the short term gain at this point. And then this will bring us to the bear trap, which is a really important indicator to take note of and something we’re going to talk about a lot. You can see this, this “U” formation there. That is the bear trap, but do not be fooled by this. Sell off this dip here because as soon as it starts to go back up, this is when The media notices and when the media notices, the public notices. And at this point, it brings us to this panic phase where everyone thinks it can only go up, up, up from here and they’re going to get left behind in the dust if they don’t jump on board right away. Everyone wants a piece of the action, which is only natural, but eventually that enthusiasm will turn into greed and people will keep adding more and more. They can’t get enough, and it’s only human nature, as we all know, that once something is moving in a certain direction, you think it’s going to move in that direction forever, but nothing lasts forever. This time isn’t different, and this is where people get themselves into trouble is by holding on too long. Up here at the top is actually where you have the biggest profit opportunity. Somewhere between delusion and denial of this curve right here is going to be your biggest opportunity for profit. And if you don’t seize this opportunity, this is where people find themselves in trouble. They hold on too long, they get lulled into the bull trap. They keep waiting, waiting while oh, oh, it looks like it’s returning back to normal. Things are stabilizing. But if you’re able to apply and read these patterns, you know that that is just simply not the case. And this brings us to what is going on right now and why it is so important to understand these patterns at this moment in time.
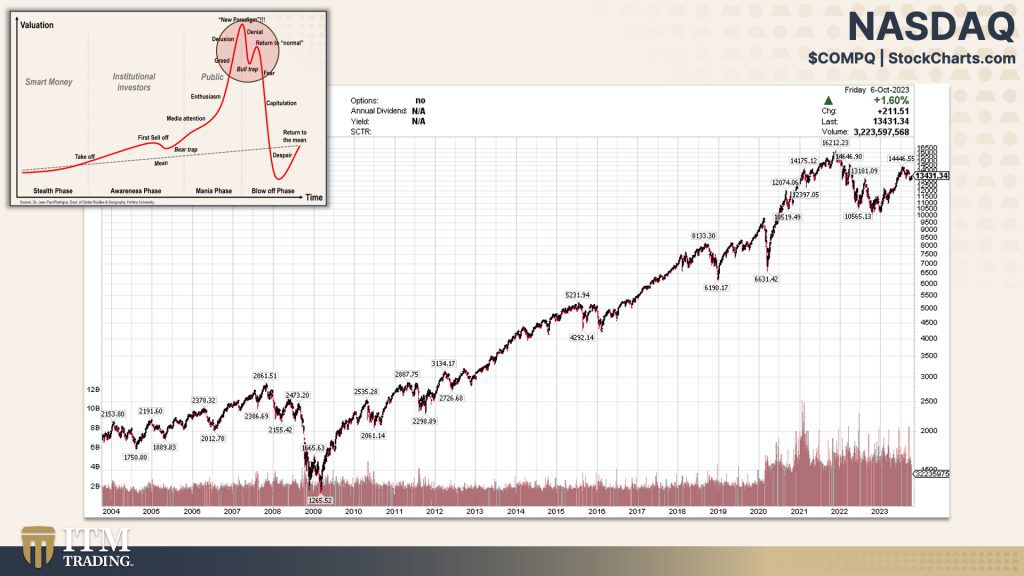
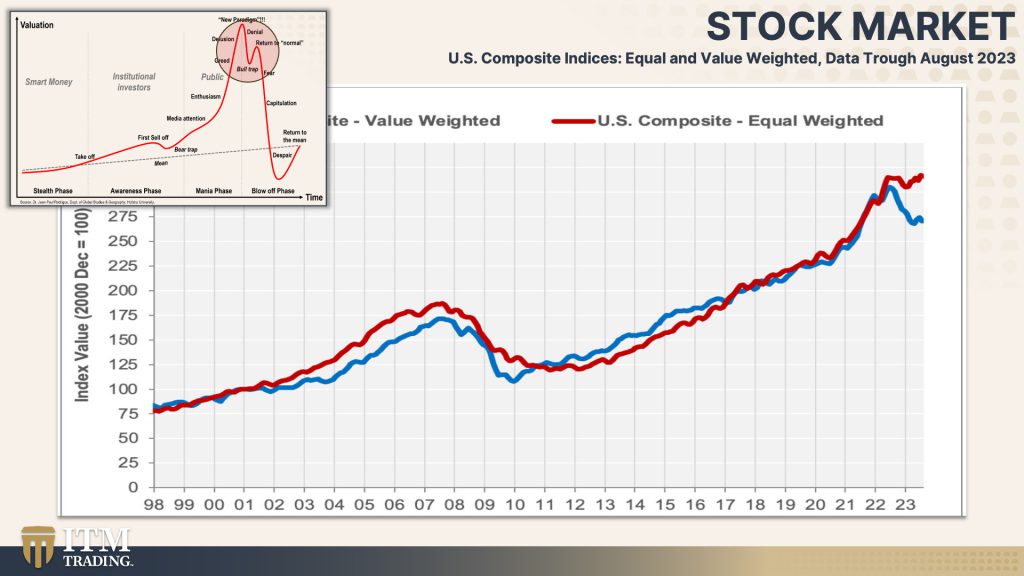
Let’s look at the stock market together and utilize the tool we just learned. Here’s the NASDAQ. Does this graph look familiar? Because it should. Everyday in the media we are being told that things are stabilizing, the outlook is looking good, things are returning to normal. But if you know what to look for that cannot be further from the truth, you will know that we are simply in a cycle and a pattern that is proven. Time and time again, these assets have been pushed and propped up. People want it to be true, but it is not the case because inflation and overvaluation are real. So right now what we’re seeing is actually an overvaluation profit opportunity relying on proven patterns. We know that fear will follow and as soon as fear strikes, things will move quickly. What we don’t want are to be making decisions based out of fear. Instead, we wanna be making educated decisions based on proven patterns, but that’s just one example.
So let’s look at commercial real estate. Take a step back, look at the big picture and see where we are in this pattern. This is where sentiment gets confused because people might be looking too closely and go, well, it’s down a little bit or it’s going up a little bit. It’s down from where it was, but it’s coming back. But if you take a step back and you look at the big picture, it is clear as day overvaluation profit opportunity is the phase that we are in right now. As Lynette likes to say, this isn’t rocket science, it’s just reading patterns and we can see this playing out in real time. I have people ask me all the time, how is it possible that we have all these vacant lots and store closures, yet commercial real estate hasn’t completely crashed? Well, we could assume or we could look at a proven history and say, oh, this is exactly why. This is where we’re at today. And more importantly, this is what’s coming next.
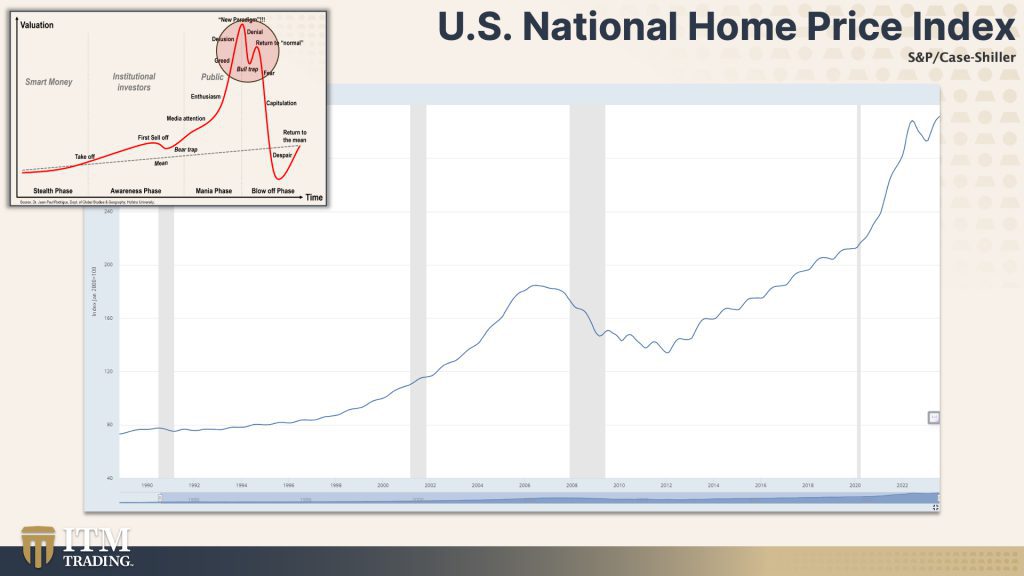
Moving on to housing. We have the national home price index here. Does this look like smart money, quiet accumulation, or does this look like greed and delusion? You tell me what you’re seeing in this graph, but I think you’re starting to get the idea. There is mass denial and confusion right now going on in the housing market, which is only natural based on where we are in the cycle. So you are going to see some markets doing well, some not as well, and things really fluctuating here in the short term. But what’s important is that you understand the big picture. Everything is designed to keep you in the system. You have been told time and time again that housing real estate is a safe investment, is a terrific short-term investment. And of course you need a roof over your head. But speculation and being told that things are a guaranteed safe investment is where you are going to get yourself into trouble and where it becomes so important to make these informed decisions for yourself.
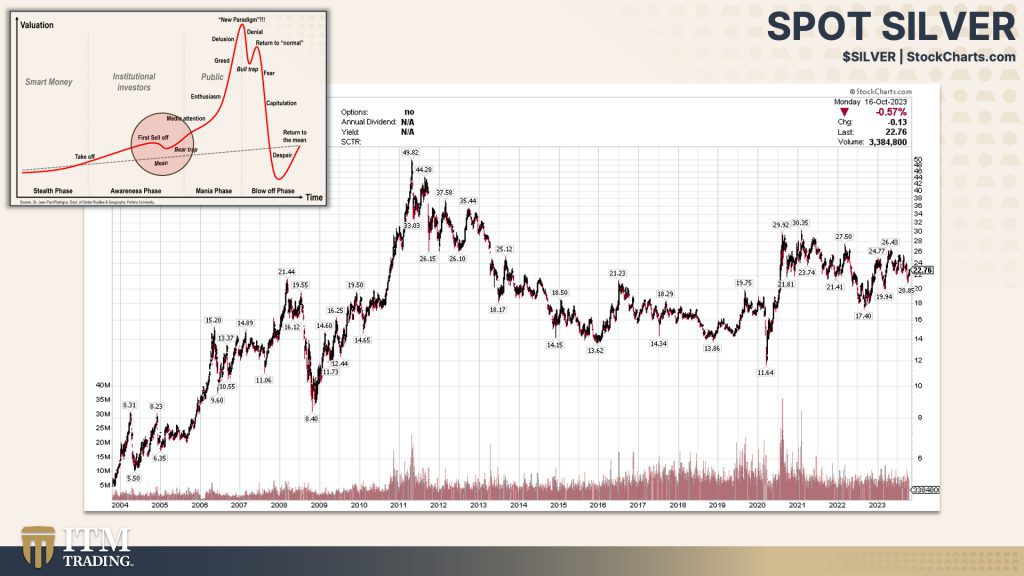
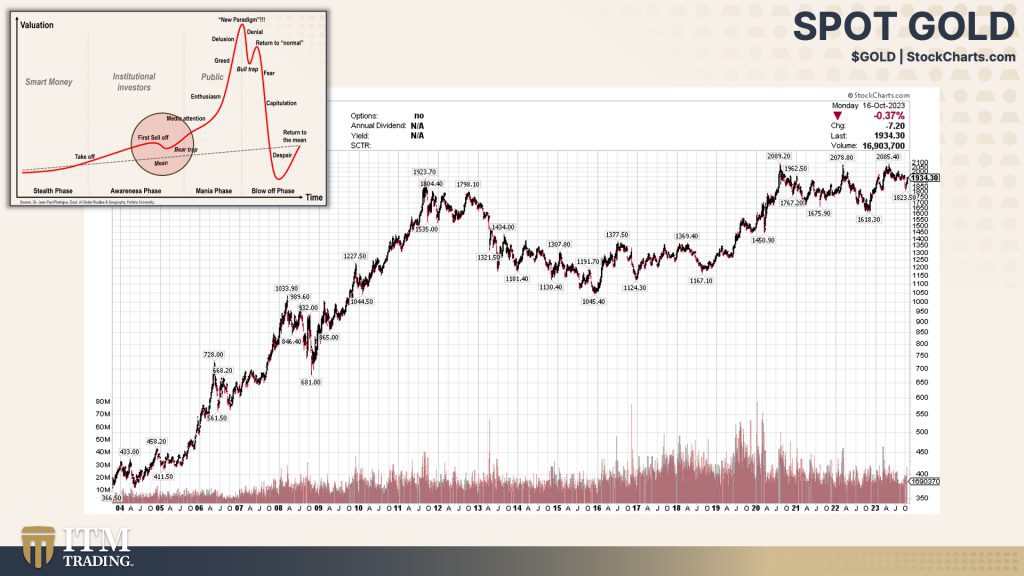
Let’s move on and talk about something a little bit different. Spot silver and spot gold. Now, as a quick reminder, it is very important that unlike physical silver and physical gold, these spot markets, these paper markets, there’s no limit to how much can be created. Now with that being said, let’s look at silver first. Here we can see with spot silver there is a wedge formation, a wedge formation that is caused by higher and higher lows and lower and lower highs. This is bringing us to a pressure point and eventually when that pressure point hits, it has to either pop up or dip down, but we know our patterns. So since we’re in a bear trap awareness phase, we’re going to see this either continue with the “U” formation or come out the other side of that “U” formation and pop up. Now again, physical silver, physical gold, very different. I know a lot of times though, when people are talking about gold prices, they’re referring to spot gold. So let’s take a look at the Spot Gold chart as well and see what we can understand there from these patterns. Looking at this, it is so clear. We can see the takeoff, we can see the takeoff clear as day, and then that bear trap, that “U” formation, which means that a rise is coming. It is clear where we are in the cycle. And what’s really interesting to me with this one, with the spot markets in particular when we’re talking about gold and silver, is the undervaluation, the undervaluation of these assets versus the overvaluation of assets such as the stock market or the real estate sector.
Smart money Knows to be in an asset that is undervalued with a long-term positive trend versus overvalued with a long-term negative trend. But do not blame yourself if you did not see this before or you didn’t understand how and why the overvaluation was happening. It is designed that way. It is designed that way to keep you in the dark so that at the end of the day you are the one left holding the bag. But you and I now have the knowledge, the knowledge, that there’s nothing normal about what’s going on. The only normal thing is that we are in a proven cycle, a pattern, and that we can use that knowledge so that we can make the best informed decisions moving forward and not be blindsided when something goes wrong. My sincere hope for you is that you can now feel empowered to make these decisions that are right for you, and they’re not based on guessing or fear. Don’t get trapped in their system with overvaluations and inflated numbers.
When we look at gold and silver at physical gold and silver, we know that it is not being impacted by these fiat currency overvaluations. Instead, we know that it is holding its purchasing power, that it is holding its value. And that is so important when we’re looking at what is going on today and where we are in this cycle. If you’re interested in learning more, be sure to check out Lynette’s deep dive video on this subject. She goes into a lot more detail, and as always, make sure you’re subscribed because we will continue to put out videos that speak to these different topics and also share with your loved ones because there is strength in numbers and the more people that see this and understand it, the more power we all have together. I sincerely hope that by providing this resource as a quick reference, it will help you and your strategy moving forward. I’m Taylor Kenney with ITM Trading, breaking down complex financial topics together so we can all learn and grow. Until next time.
SOURCES:
https://stockcharts.com/h-sc/ui
https://fred.stlouisfed.org/series/CSUSHPINSA
https://www.mining.com/gold-elevates-to-2nd-most-popular-long-term-investment-in-us-poll/
