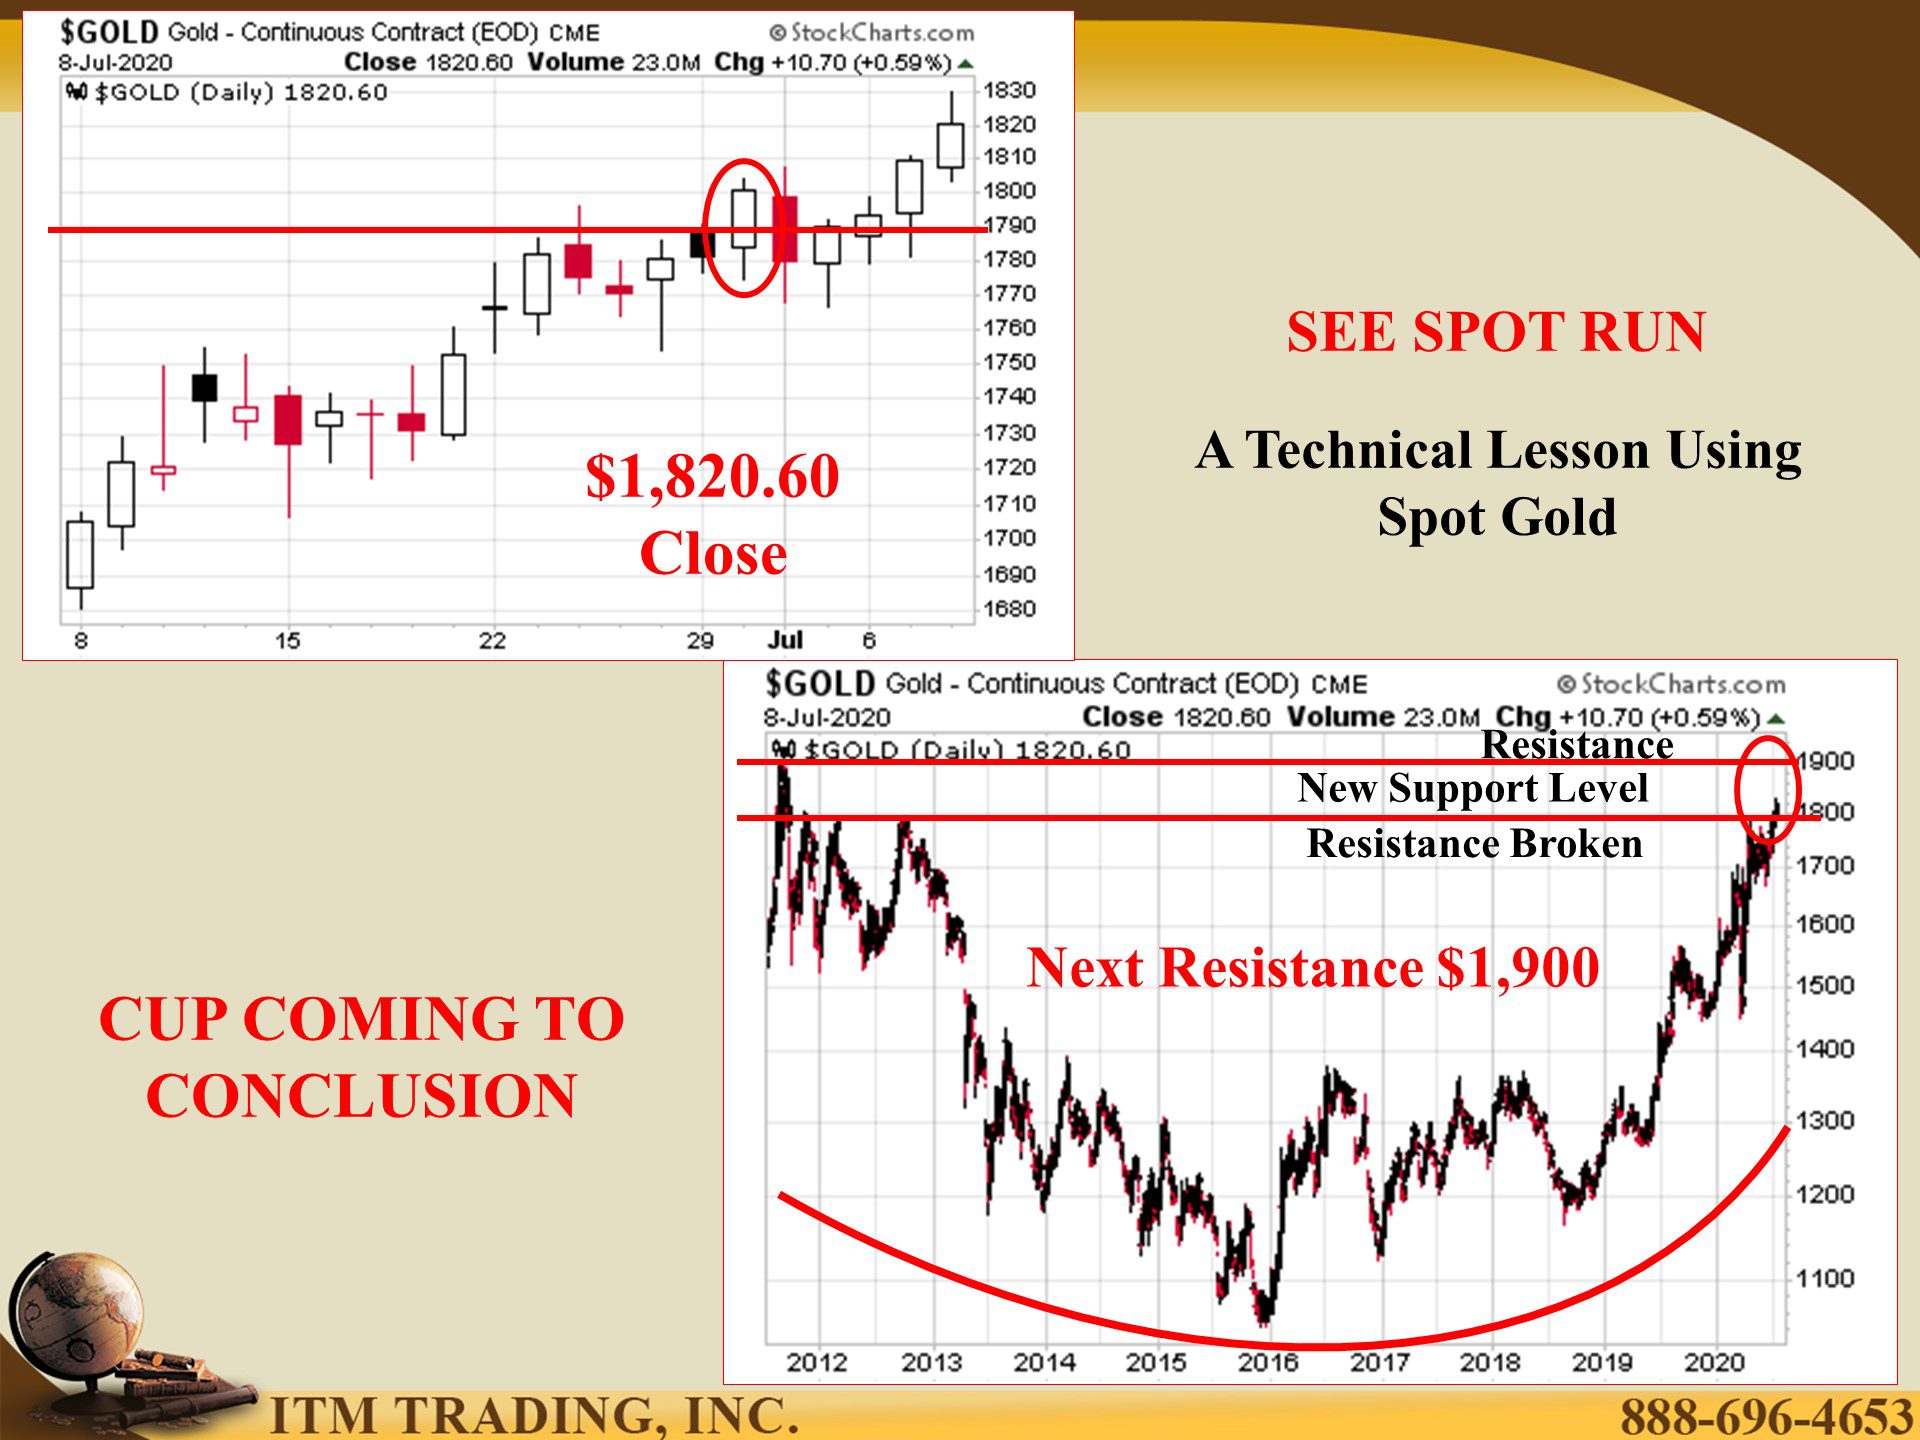
SEE SPOT RUN: A Technical Lesson Using Spot Gold by Lynette Zang

On Tuesday, June 30th, spot gold closed above levels last seen in 2012 then spent a few days consolidating that position and moving higher. Today, intraday, spot gold hit $1,830 and closed at $1,820.60, a high last seen in 2011 and is fast closing in on its last resistance level of $1,900. When that happens, the accumulation pattern (cup formation) that began then will be concluded.
Why does this matter? Two reasons: First, if you understand how technicals work you can use it for everything and anything, but more importantly because it tells you and me that gold is preparing for the financial system reset and the smartest money in the room has been accumulating it.
In my opinion and technically speaking, I believe this is your last opportunity to buy physical gold and silver this cheap. If gold is getting ready for the reset, shouldn’t you?
Slides and Links:
https://stockcharts.com/h-sc/ui