FED PREDICTS SEVERE DROP: [Pt-1] Stocks & Real Estate
My favorite question is “How many times can you be lied to when you do not know the truth?â€
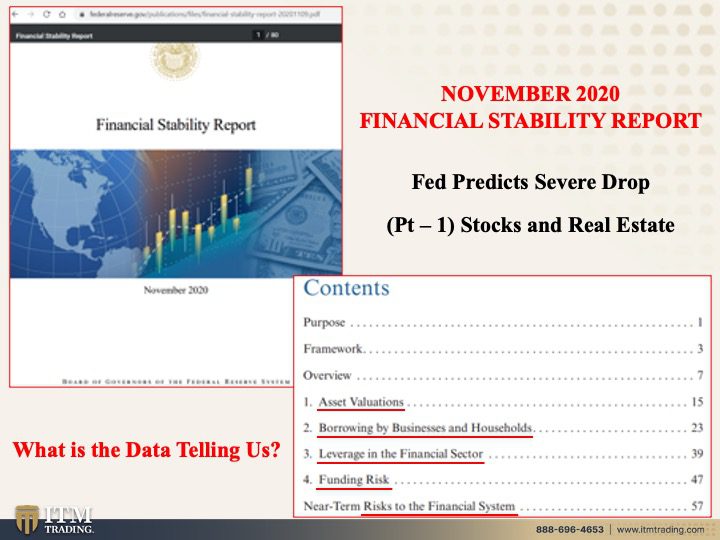
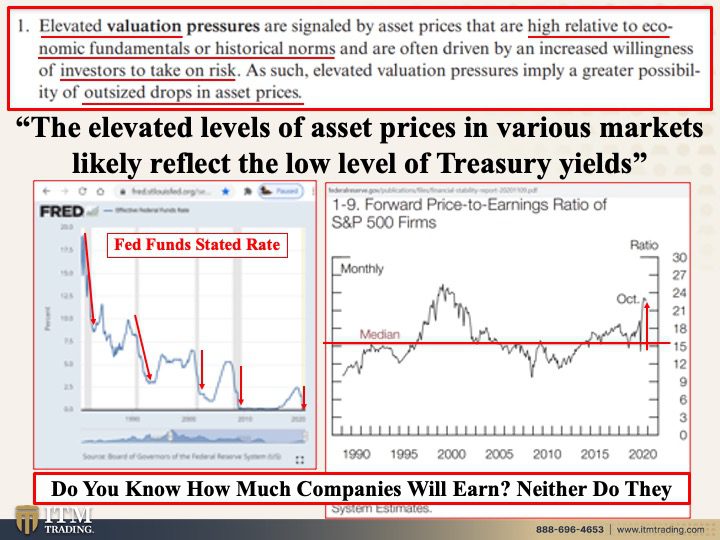
The Fed just came out with their November Financial Stability Report and frankly, it does not look good. Always indicating their concern for “future†bubbles, they somehow manage to justify the valuations of the “current†bubbles caused by their policies. I’m just grateful that they provide great graphs that reveal a more truthful view of the tales they like to spin, which is also referred to as “perception managementâ€.
Have more questions that need to get answered? Call: 844-495-6042
This report is broken into four parts: Asset Valuations, Borrowing by Businesses and Households, Leverage in the Financial Sector. We will tackle each part because there is so much to understand.
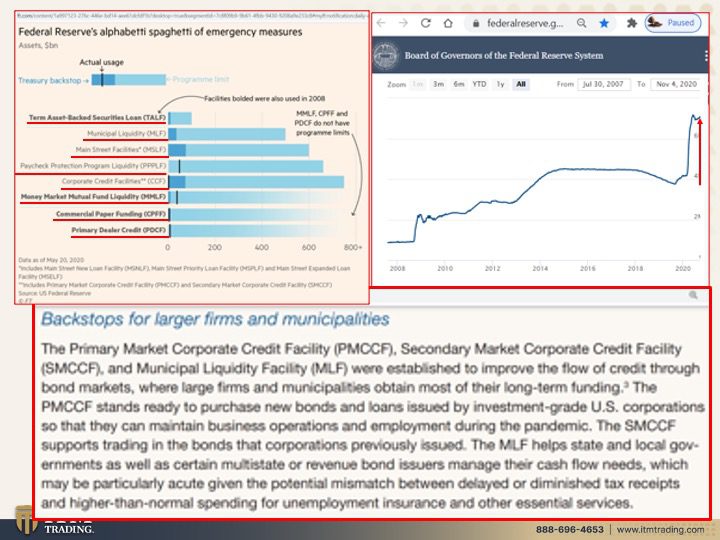
With real estate, stocks and bond prices at or near all-time highs and most corporate incomes questionable at best, the Federal Reserve cooked up an alphabet soup of SPVs (Special Purpose Vehicles) designed to reflate the bubbles their ZIRP (Zero Interest Rate Policy) created from the last crisis in 2008. After all, in a debt-based system governments, corporations and individuals MUST continue to borrow or markets will implode under their own, over indebted weight. That’s why the incessant call of the Fed is for inflation.
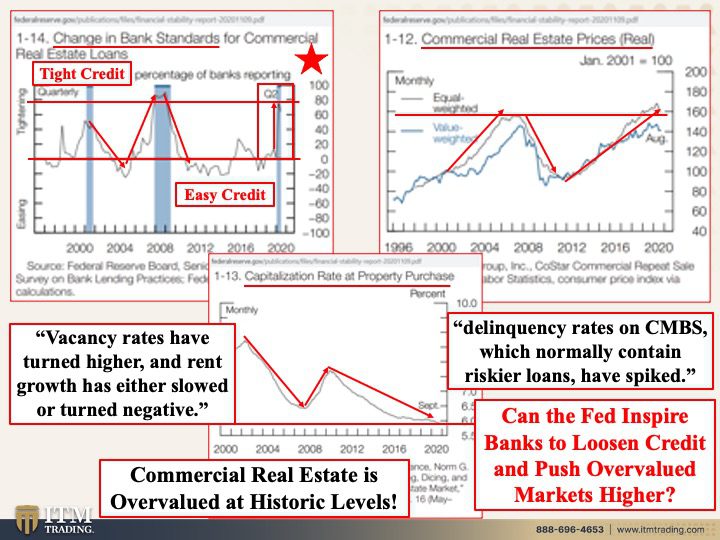
Real estate, particularly the commercial real estate bubble has popped in major cities, like New York and San Francisco, as the “work from anywhere†trend evolved during this pandemic. Interestingly, commercial real estate prices have not really fallen that much…yet. There is danger on the horizon.
The Fed’s data shows that the ROI (return on investment) is at the lowest point since tracking began, meaning that CRE (Commercial Real Estate) valuation is at an all-time high.
In the domino effect, once one domino falls it will most likely topple many other investor dominoes, like REITs that many retirement plans hold for income. And since the mortgage moratorium ends December 31st, it may become apparent who has NOT been paying. This could create a flood of commercial real estate on the market and this should push CRE prices down substantially.
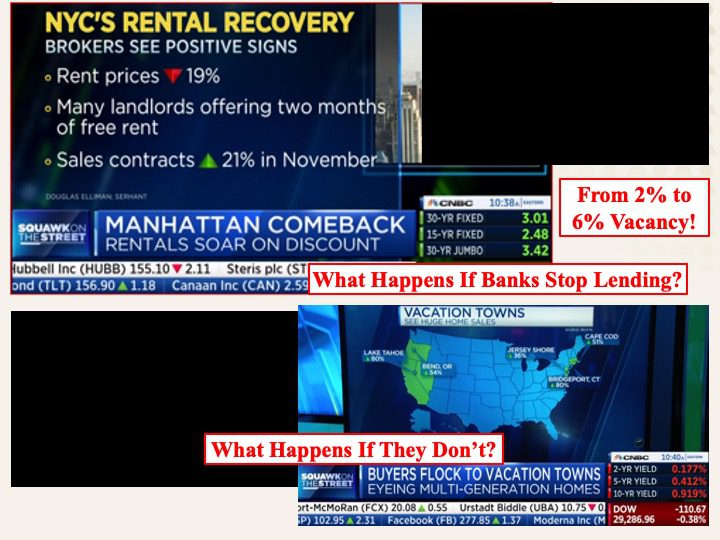
Interestingly, this report showed how bank lending standards have impacted the nominal value of real estate. These lending standards have been mostly loose since 2009 but tightened at a speed faster than that in 2008.
That means that investors needing to roll over or take out new loans might not be able to do so. If that happens, how long do you think it might be before we see some significant price drops in commercial real estate?
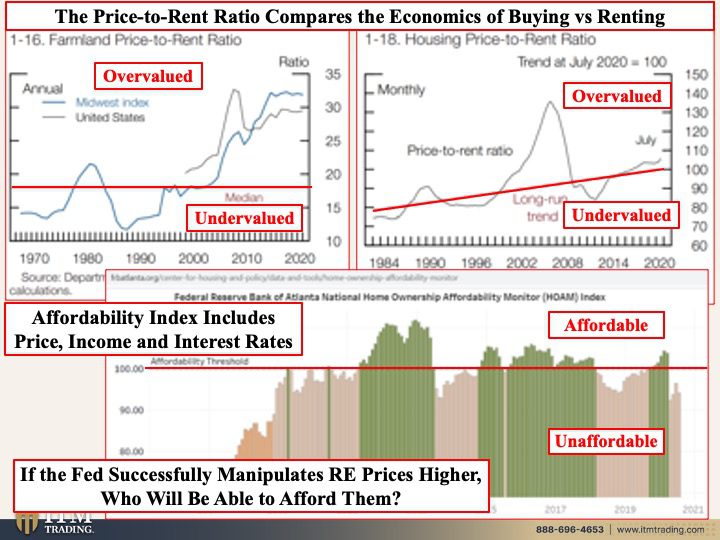
But that is not the only real estate that is in jeopardy. This report also showed that both farmland and housing is overvalued to economic fundamentals using the Price-to-Rent ratio, though that does not show affordability. For that we took a look at the Atlanta Feds data and guess what we found? Homes are unaffordable for most. So if the Fed successfully gets banks to loosen their lending standards to push all kinds of real estate to new highs, who do you think will be able to afford it?
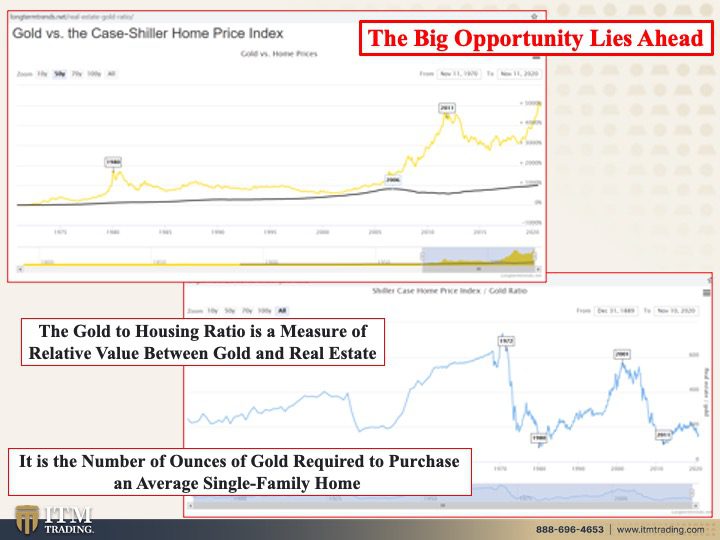
Those with the foresight to position into gold. In 1970, at the peak, it took 738.04 ounces of gold to buy the average house. At today’s writing, it takes 155.74 ounces of gold to buy the average house. Historically during a hyperinflationary reset, 25 ounces of gold, on average, would buy an entire city block, buildings and all. That is the opportunity that lies ahead.
Slides and Links:
Slide 1:
https://www.federalreserve.gov/publications/files/financial-stability-report-20201109.pdf
Slide 2:
https://www.federalreserve.gov/monetarypolicy/bst_recenttrends.htm
https://www.ft.com/content/7dc752d5-ddd3-4932-b5f4-420b1d9a73b8
Slide 3:
https://fred.stlouisfed.org/series/FEDFUNDS
Slide 4:
https://www.federalreserve.gov/publications/files/financial-stability-report-20201109.pdf
Slide 5:
https://www.federalreserve.gov/publications/files/financial-stability-report-20201109.pdf
Slide 6: N/A
Slide 7:
