The Role of the Inverted Yield Curve During Economic Downturns EXPLAINED
Ever wondered if there’s a way to predict economic downturns? Understand why high yield rates are sending shockwaves through the economy and how you can shield your assets. The alarms are ringing, and the signs are clear. Don’t miss this chance to stay ahead of the financial storm.
CHAPTERS:
0:00 10-Year Treasury Yield
3:07 Yield Curve Inversion
5:11 Bonds & Interest Rates
6:58 Accurate Prediction?
TRANSCRIPT FROM VIDEO:
What if I told you that there was a way that you could predict the next recession before it happened and that the alarm bells are going off right now? The 10 year treasury yield is at a 16 year peak, not seen since 2007 right before the Great Recession. This yield is also measured on a yield curve that has accurately predicted every single recession since the 1950s before it happened. And right now, that yield curve is telling us that we are on the brink of the next big one.
Hi everyone. I’m Taylor Kenney with ITM Trading. There has been much talk in the news recently of the treasury yield rates and what this spike combined with an inverted yield curve means for the economy. In the past, they have been clear indicators of an economic recession, but why exactly are the yield rates so high? What does an inverted yield curve mean and what can you do with this knowledge to better protect yourself?
In order to explain what these indicators are and how they impact you, it’s important to first quickly understand what government securities are. The ever-growing US deficit is funded through the sale of government securities or bonds. These bonds are money that an investor lends to the US government with the promise that they will be repaid with interest over time. The interest or the money that you would earn annually is called the yield. The principle is the face value of the bond, which will be repaid on the bond’s maturity date. And the maturity date can range anywhere from as little as 13 weeks up to 30 years. The yield rate can actually rise and fall in the open market depending on how much the bonds are being sold for. So the principle remains the same and the amount of interest remains the same. But if that principle, if you have a thousand dollars bond, but it’s being sold for $980, the yield rate actually is going to increase the difference between what the bond is being sold for and the principle plus the interest rate.
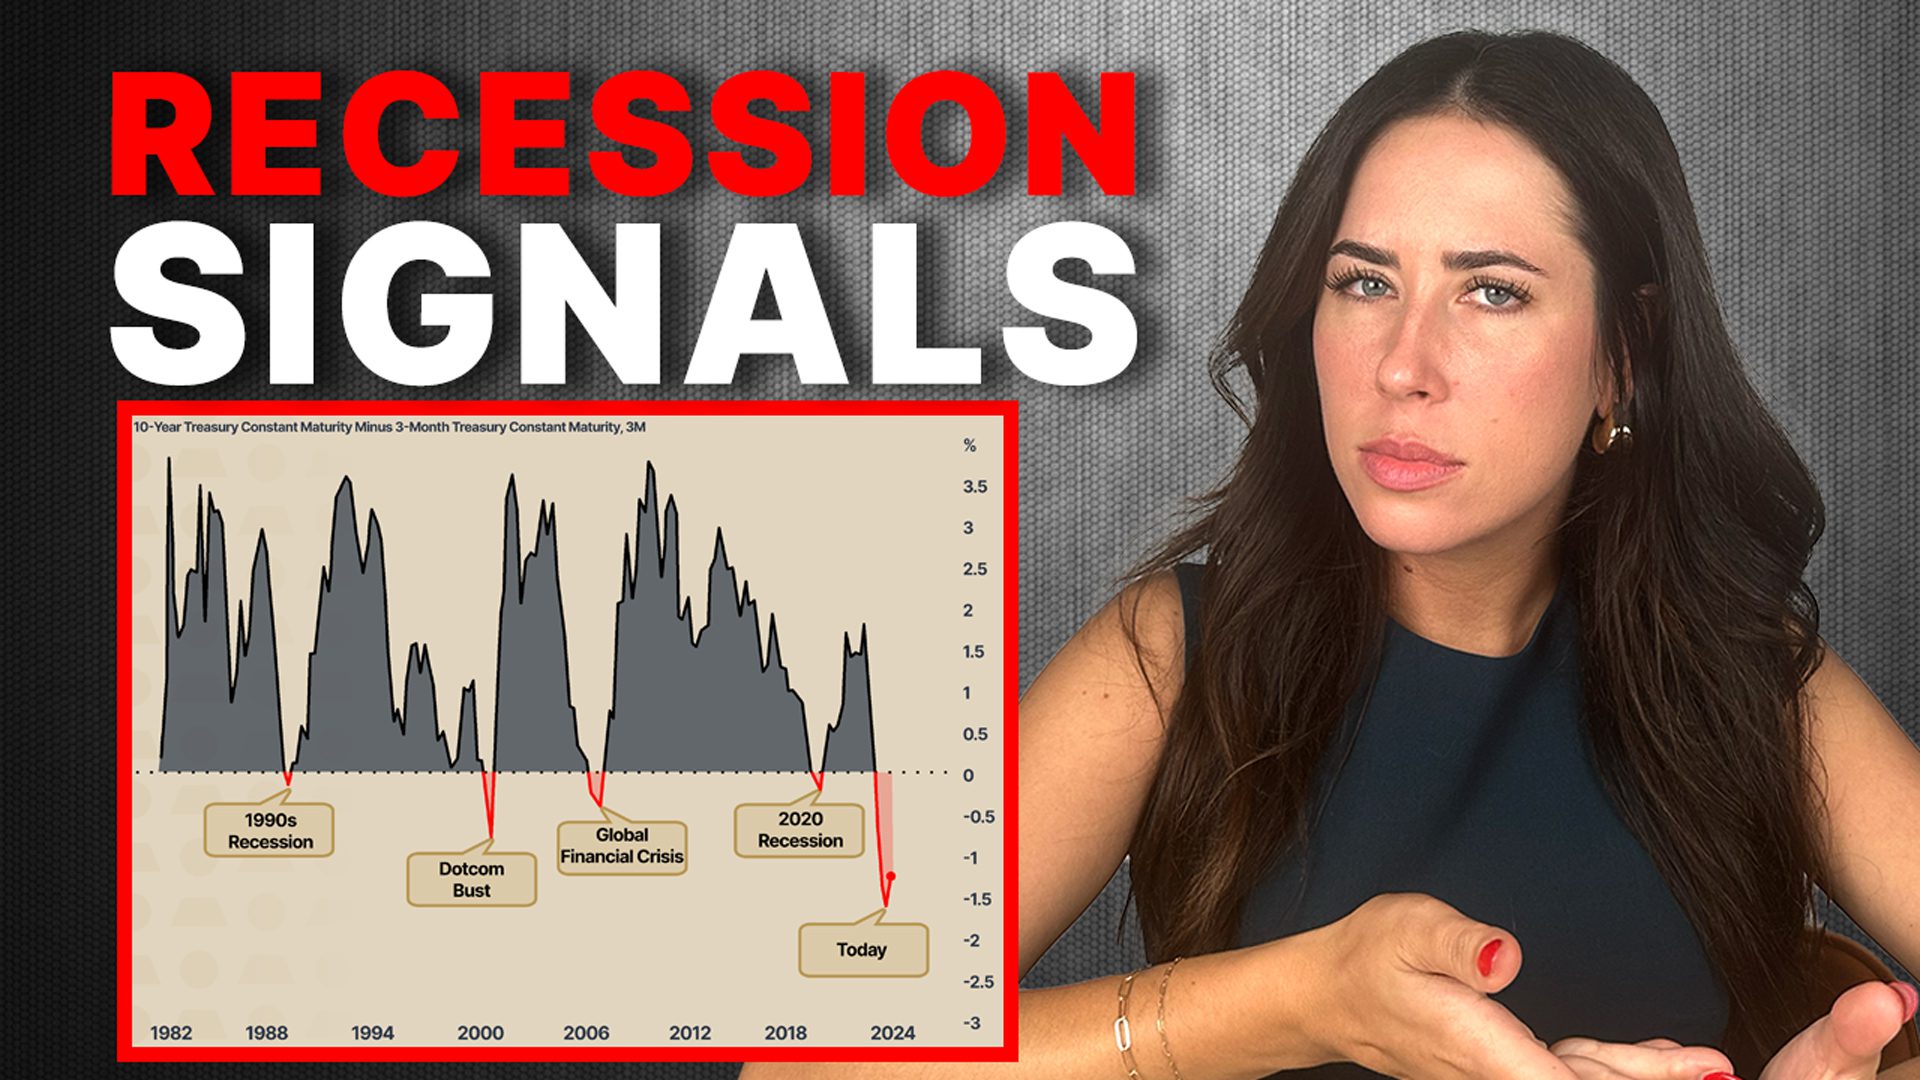
So there’s an inverse relationship between yield rate and bond price. As bond prices drop, the yield rate goes up. As bond prices rise, the yield rate shrinks. This yield rate is often viewed on something called a yield curve. On the horizontal axis, you have the length of maturity from shortest to longest, and on the vertical access you have the yield rate percentage. In a healthy economy, you can expect to see that the further out you go, the longer the maturity date is, the higher the yield rate percentage is. Now, if an economy is struggling or things seem like they might be uncertain in the future, that yield curve might begin to flatten out and even in some cases, invert. And you’re going to see this when a short-term security has a higher yield rate percentage than a long-term security. When this happens, it is a clear indicator of trouble on the horizon and investors know it, hence why they want short-term securities and they do not wanna bet on the future.
This inversion has happened before every single recession since the 1950s, and we’re in one now, and that’s only one of the factors that we’re looking at. In addition to an inverted yield curve, we are also seeing the yield rates themselves spike up at an alarming rate. Traditionally, a higher yield rate indicates that we are reaching the end of the current cycle that we’re in, that we’re at the peak, and a downturn is coming again. The last time that we saw 10 year treasury securities at the rate that they are now was in 2007, and we all know what happened in 2008.
So why is this happening? Well, bonds have historically been viewed as a safe bet. You might know them as something that your grandparents give you a Christmas and you’re not gonna make a ton of money with them over time. You wait 10-20 years to get a small amount of interest, but they would be considered a safe bet by some. When investors think that the economy is strong, inflation is low, they are more likely to put their money into long-term bonds because that fixed rate of return and the economic future seems pretty solid.
However, on the flip side, if inflation looks like it’s going to be high and they are uncertain about the future, the last thing they want is a fixed rate of return 10 years out. Because it’s a deteriorating diminishing asset, that rate is going to be worth less than 10 years than it’s worth today. So you could actually be losing money on these longer term bonds. Hence why you get the inverted yield curve when more people are interested in short-term bonds. Now, I don’t have to tell you that we’ve recently experienced record high interest rates as a result of gross overspending by the federal government, but many assumed that inflation was under control because that’s what we have been told. Inflation is coming down, inflation is under control. If that were to be the case, then many would assume that interest rates would also come down. They would stay steady or come down, but that is not the case.
It’s been confirmed that interest rates will most likely go up, which confirms what we all knew, that inflation is not under control. And this is just one of many factors of why bond prices are lowering and yield rates are rising. In addition to the interest rates, the US government has actually needed to issue more bonds, more securities to pay for their debt. And what happens, it’s basic supply and demand. The more bonds that are issued out, the less demand there’s going to be. So they will be bought, but at what price? As there are more bonds available, investors expect to be paid higher rates. This coupled with other external concerns such as rising oil prices, have people panicked. They’re wondering if the risk is worth the reward. It’s no longer looking like your grandpa’s safe bet. The only reason that these are considered safe bets is because they are backed by the full faith trust and belief in the Federal Reserve and the US government. So the more uncertainty that there is around those institutions, the less safe they look.
All of this to say, it’s not as though we needed another indicator. The bad economic times are ahead of us and not behind us. But this is important for those who are still not seeing the big picture or not believing and understanding what is actually going on. For those who are still not convinced, these treasury yield rates are a sound indicator of what’s to come. We are witnessing the 10 year treasury yield a benchmark indicator at a peak that has not been seen since 2007. This is the result of many different indicators that combined signal that there is a poor economic outlook and a recession incoming.
Again, the yield and the curve it’s measured on has accurately predicted every recession since the 1950s and it’s predicting another one now. Listen, I can’t predict the future any more than you can, but what I can do is look at what history has taught us and apply it to what’s going on right now. But the good news is, is that it’s, it’s not all doom and gloom because historically these indicators typically show up seven to 24 months before the recession hits. So how far out do we have? I don’t know. But we do still have a little bit of time. Time to get your affairs in order and make sure that you have a plan in place.
No matter where you are in your journey. I think it’s important to click the link below and make sure that you are taking the steps to prepare now while there’s still time, before it’s too late. My goal here is to break down complex financial concepts. Whether you’ve just started your journey or you’ve been here for a while, so hopefully this makes it easier to understand and easier to share. So if this was helpful for you, please make sure to like, subscribe and share with your loved ones so we can help spread the word. As always, thank you so much. I’m Taylor Kenney with ITM Trading. Until next time.
SOURCES:
https://youtu.be/PKYiGsoYm7o?si=egai3lB1Tz81NxUd
https://youtu.be/DCQwiF0J7hw?si=ESMzYwCURpgiCpDs
https://youtu.be/7x8vIvwYzFg?si=Aev0AxZGluSd4x4f
https://archive.org/details/72762WingsToNewYork
https://www.ft.com/content/4f6cd8b6-5325-461e-b926-fd4da3839aa0
https://europe.pimco.com/en-eu/resources/education/everything-you-need-to-know-about-bonds
https://www.cnn.com/2023/09/24/politics/government-shutdown-impacts/index.html
https://www.wsj.com/finance/stocks/global-stocks-markets-dow-news-09-19-2023-c850716d
https://www.gurufocus.com/yield_curve.php#google_vignette
https://home.treasury.gov/policy-issues/financing-the-government/interest-rate-statistics?data=yield


